

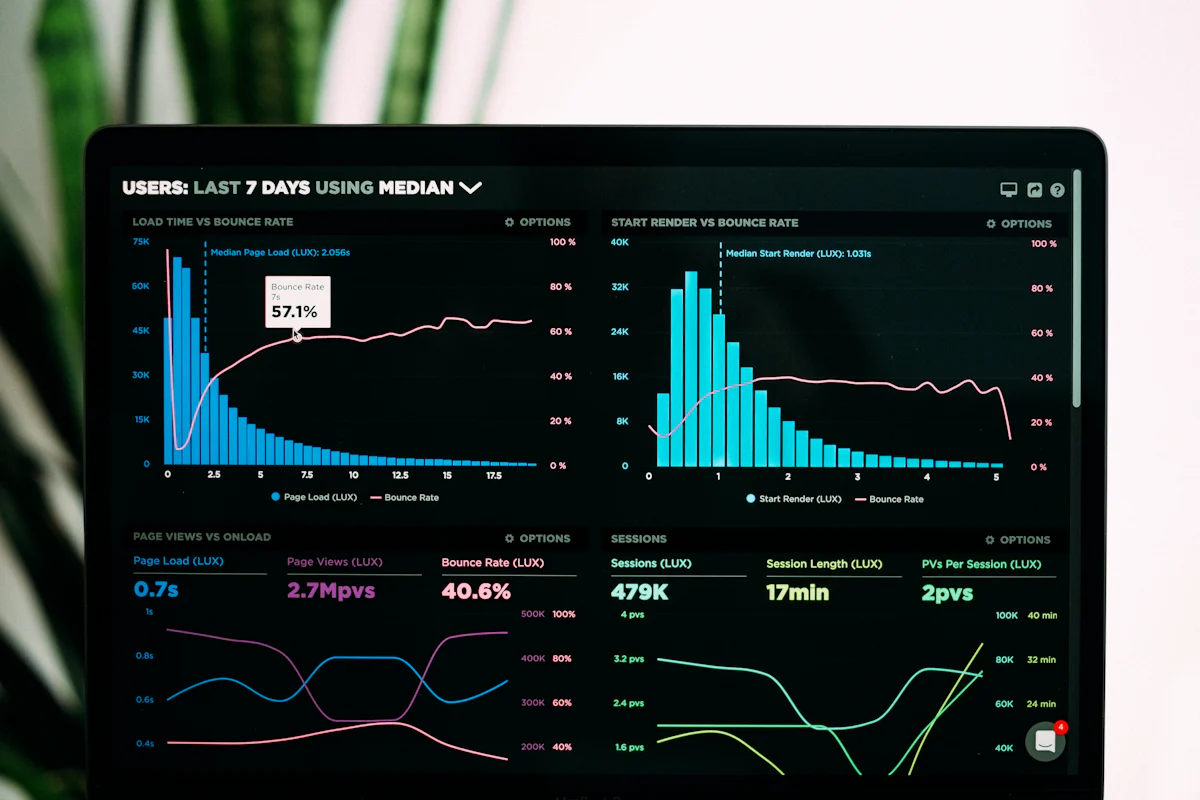
Dashboards that turn ERPNext data into decisions.
We build business-intelligence layers on top of ERPNext: consolidated finance, live project and resource views, and field-force performance, so leaders see what's happening as it happens.
All figures below are illustrative sample data, not real client information.Group financial consolidation
Consolidated performance across divisions, with inter-division activity eliminated.
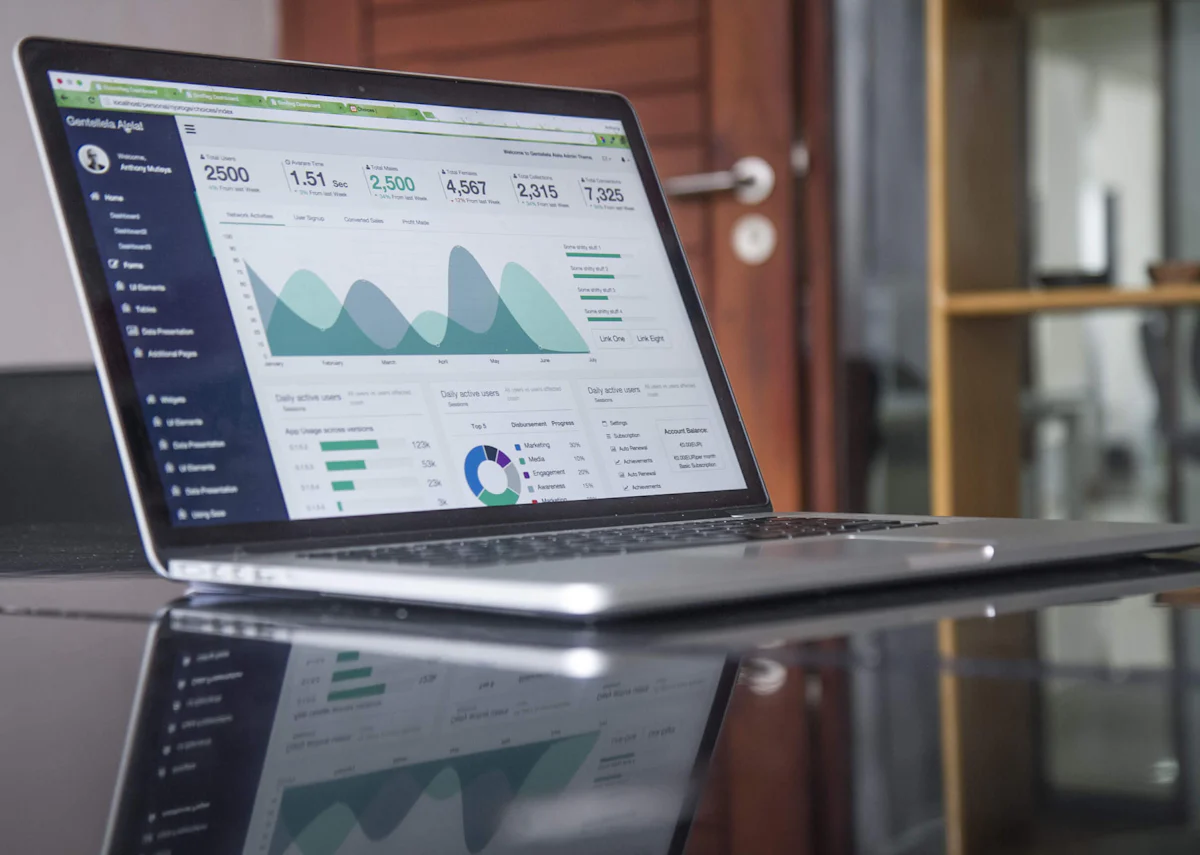
Revenue by division
FY, ₹ Cr, post-elimination
Group revenue trend
Monthly, this year vs last year (₹ Cr)
Division contribution
Share of group revenue
Consolidated P&L
Group summary (₹ Cr)
Consolidated P&L
Group summary (₹ Cr)
| Revenue | 48.6 |
| Cost of goods | (27.4) |
| Gross profit | 21.2 |
| Operating expenses | (12.0) |
| EBITDA | 9.2 |
| Inter-division eliminations | (3.1) |
Project and resource utilisation
A live view of project health and where the team's capacity is going.
Resource utilisation
By team member (% of capacity)
Project status
Portfolio breakdown
Task completion trend
Planned vs actual, last 8 weeks
Active projects
Selected engagements
Active projects
Selected engagements
| Project | Lead | Phase | Status |
|---|---|---|---|
| Riverside Residences | A. Nair | Design Dev | On track |
| Meridian Office Fit-out | S. Rao | Construction | At risk |
| Lakeview Clubhouse | K. Iyer | Concept | On track |
| Harbour Retail | A. Nair | Handover | On track |
Pharma field force performance
Coverage, geo-verified calls, samples, and target vs achieved across the team.
Target vs achieved
By territory (₹ Lakh)
Daily calls
Planned vs actual, last 2 weeks
Sample distribution
Units issued by product (this month)
Rep leaderboard
Top representatives
Rep leaderboard
Top representatives
| Rep | Coverage | Calls | Ach. |
|---|---|---|---|
| R. Menon | 98% | 312 | 104% |
| P. Sharma | 95% | 298 | 97% |
| V. Reddy | 93% | 276 | 92% |
| N. Das | 90% | 261 | 89% |
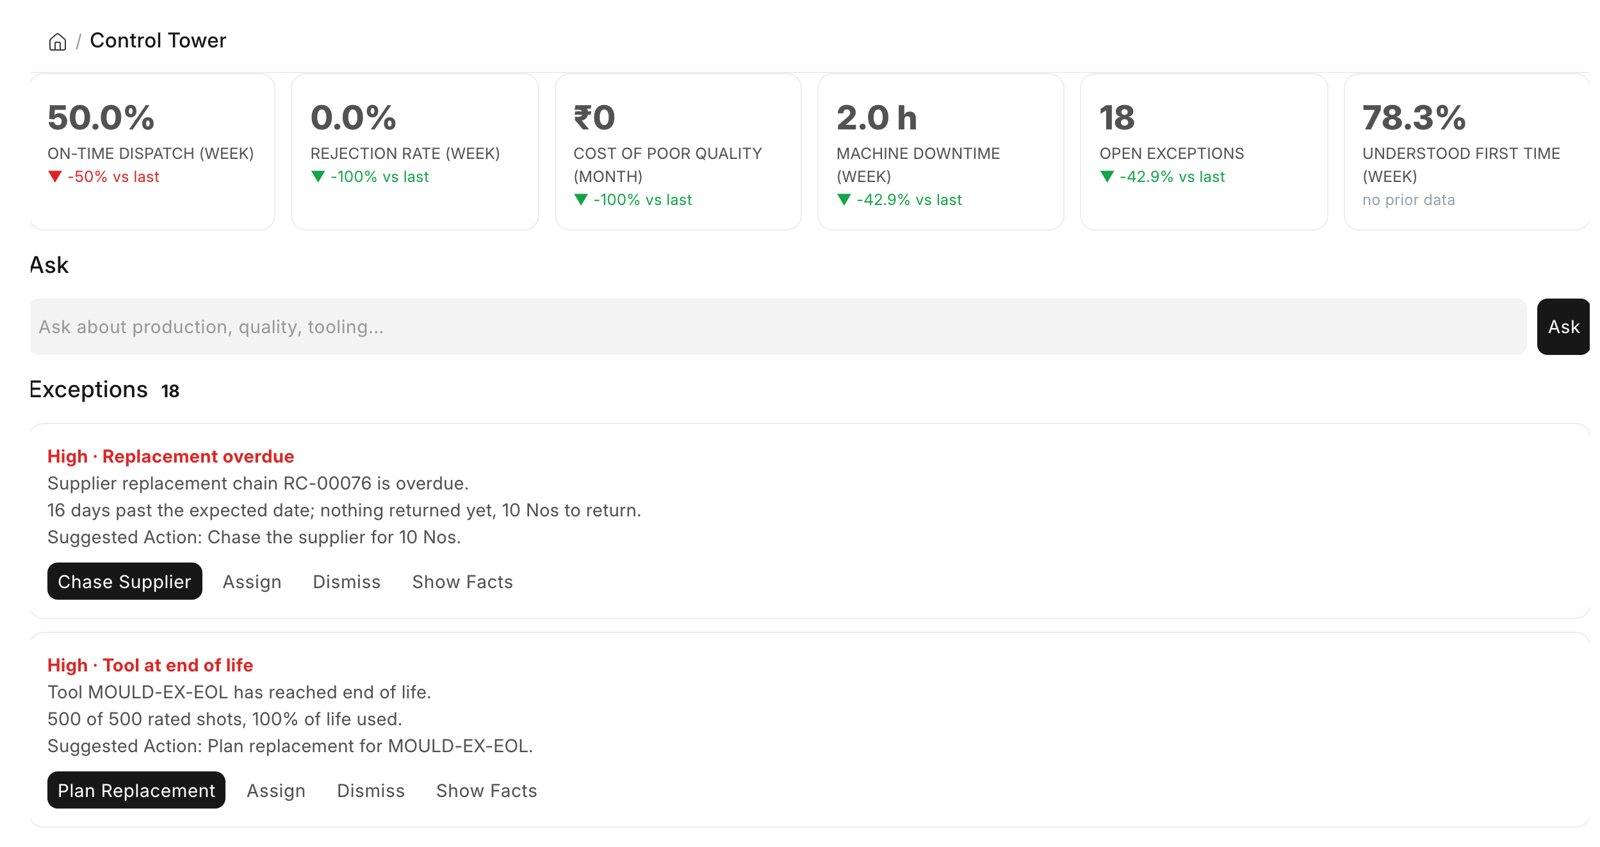
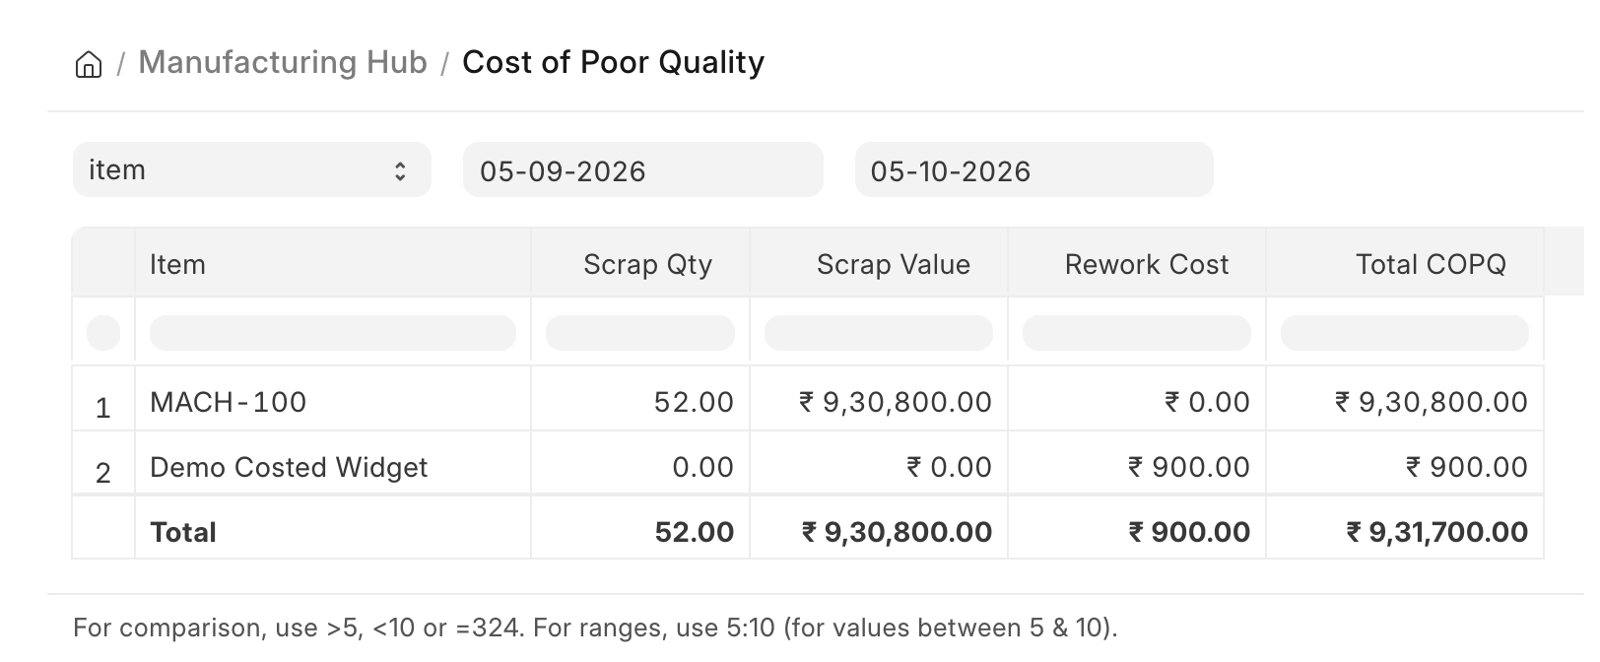
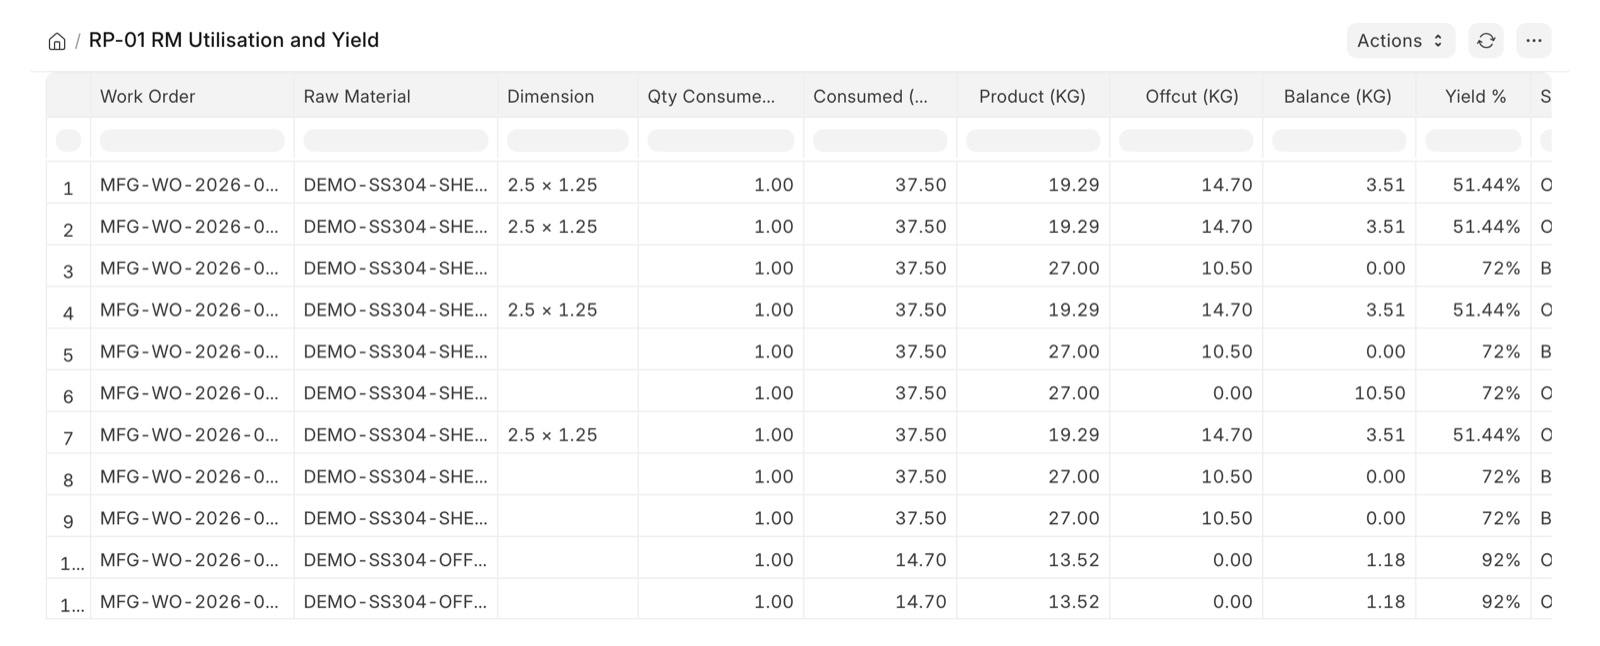
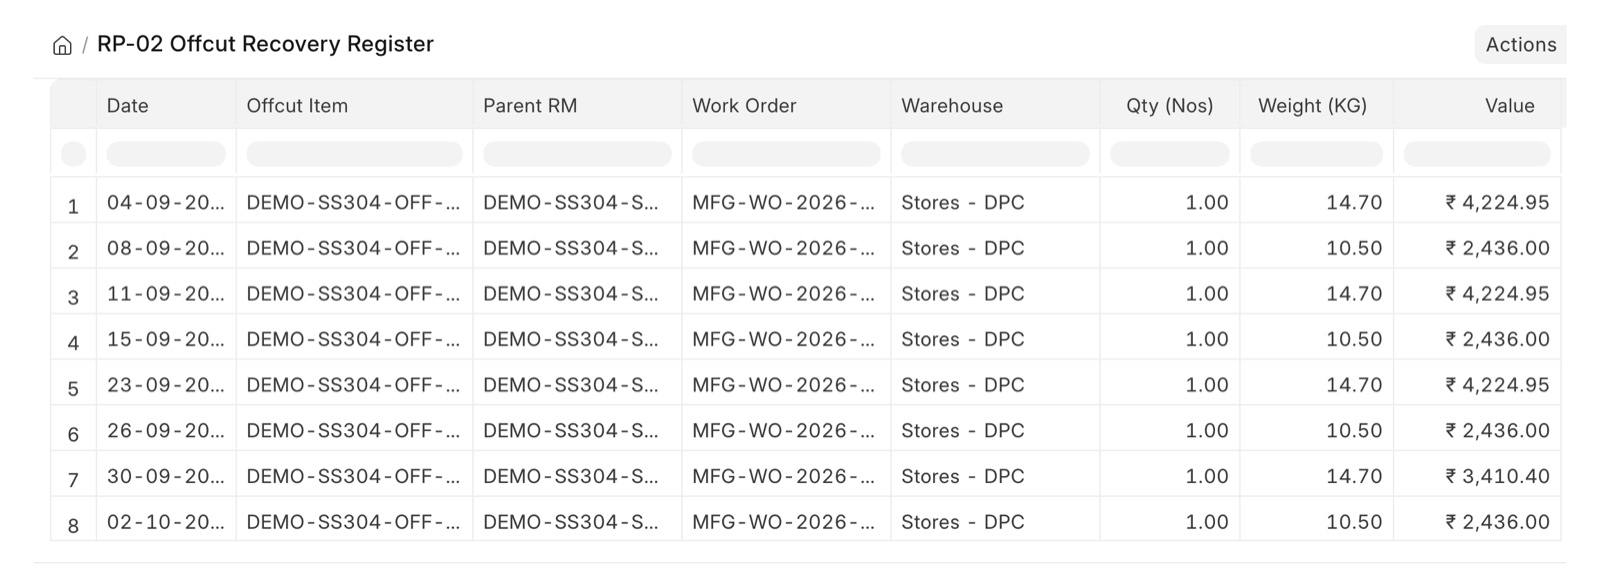
Screens from products we built on Frappe
Reporting views from our AI-Native Manufacturing Platform (piloting from December 2026) and Material Yield Tracking, built by our own team.
Ask anything about ERPNext or Frappe
Get a short, honest answer in seconds — no sales pitch. A real person is one click away when you're ready.
Chats are stored to improve this assistant. Please don't share sensitive personal details.
Want dashboards like these on your data?
We'll connect your ERPNext to a BI layer built around the numbers you actually run on.